
Activity & logs
Two tabs cover monitoring: Activity (aggregated analytics) and Logs (the per-request audit trail). Both cover every API key and connected agent, and both record metadata only — prompt and response content is never stored.
The Activity tab
Activity has four views — Overview, Trends, Performance, Explore — plus an Export button. All views share the header controls: filter by Key / agent, filter by Model, and a Range picker (Last 24 hours, Last 7/30/90 days, Year, All time, or Custom range).
Overview

Figure 1: The Activity header (view tabs, Export, filters, range) and KPI cards
The KPI cards, each with a comparison against the previous period ("vs prev" / "No prior data"):
| KPI | Meaning |
|---|---|
| Spend this period | "Total spend over the selected date range." — with the average cost per request. |
| Requests | Request count. |
| Token volume | Total tokens. |
| Error rate | "Share of requests in this period that returned an error." |

Figure 2: Top API keys & agents, and Top sources (API keys vs Agents)
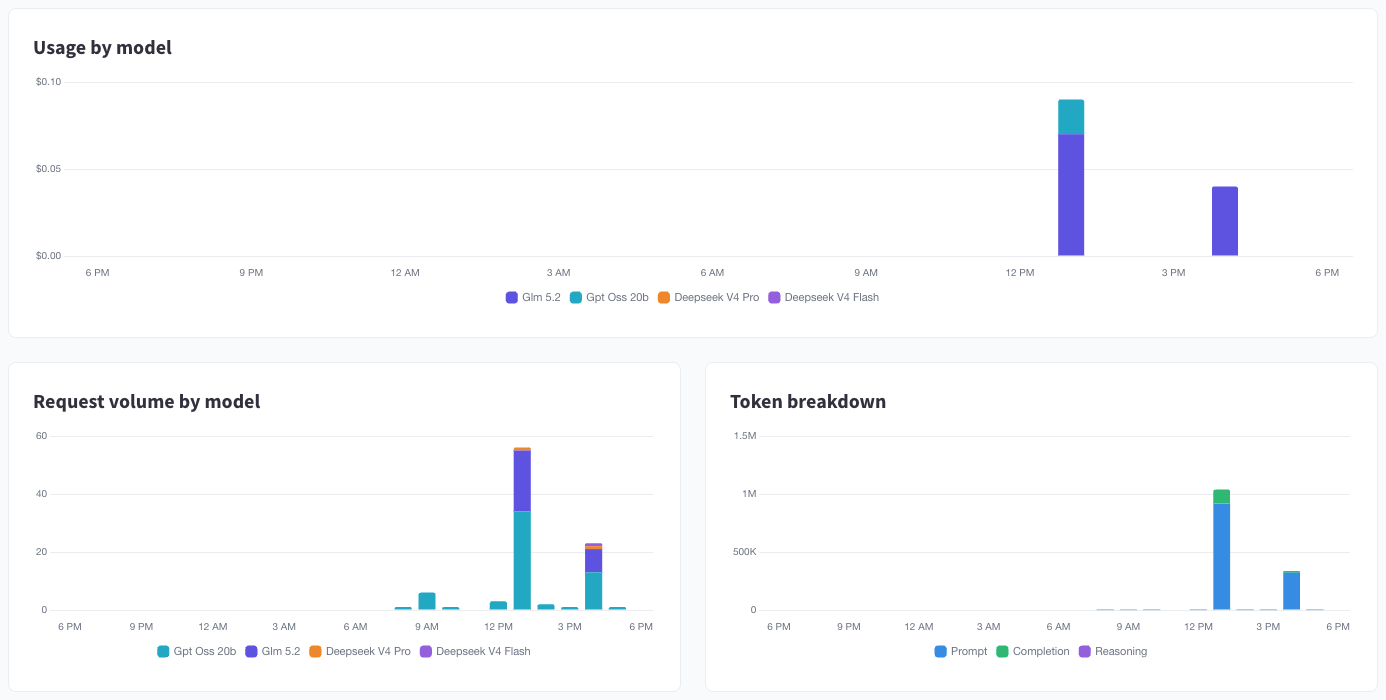
Figure 3: Usage by model (spend over time), Request volume by model, and the Token breakdown (Prompt / Completion / Reasoning)
Where prompt caching applies, a Prompt token caching card shows the Cache hit rate — "Share of prompt tokens served from the provider prompt cache." — and cached vs uncached token volumes.
Trends
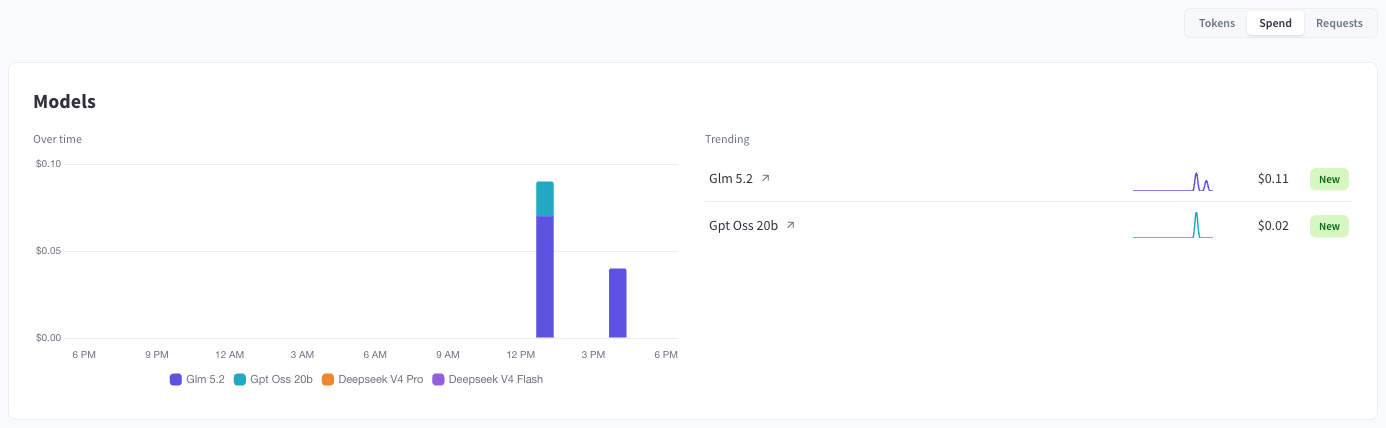
Figure 4: Trends — models over time with a Trending list; the metric switch (Tokens / Spend / Requests) is top right
Trends shows movement: each model (and each key/agent, in its own section) charted over time, with a Trending list of risers — including a New badge for entries with no usage in the previous period.
Performance
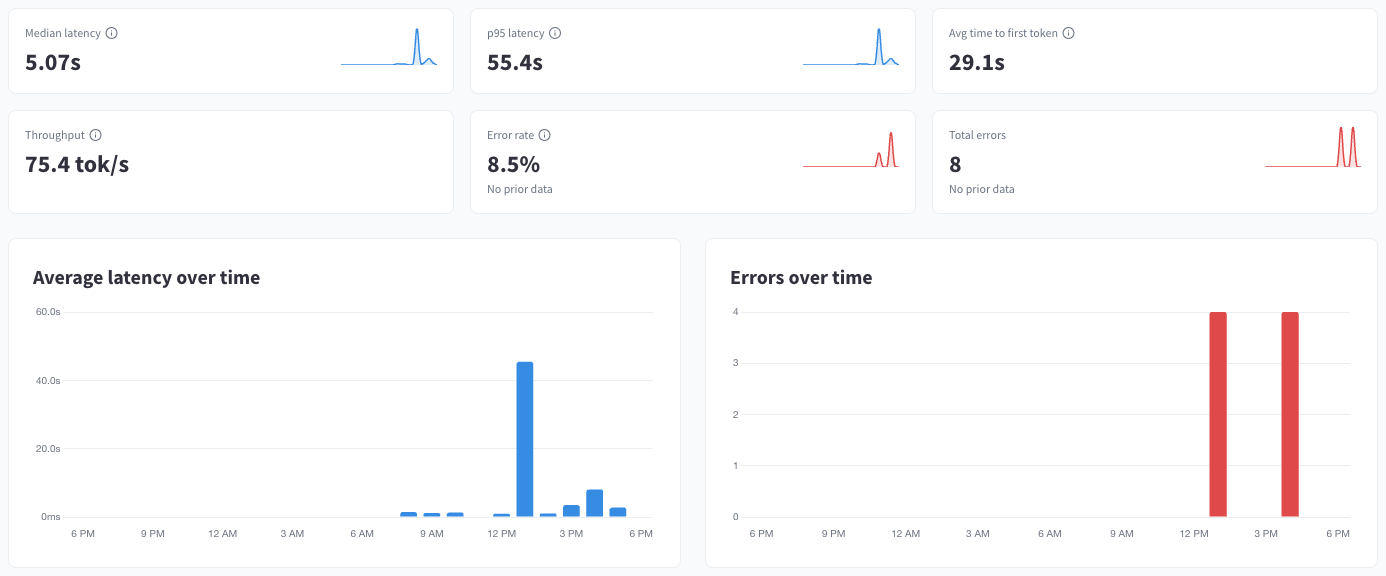
Figure 5: Performance — latency, throughput, and error KPIs with Average latency over time and Errors over time
| KPI | Meaning |
|---|---|
| Median latency | "Median (p50) end-to-end request duration over the selected range." |
| p95 latency | "95th-percentile request duration — the slow tail most users feel." |
| Avg time to first token | "Average delay before the first streamed token (streaming requests only)." |
| Throughput | "Average output generation speed across requests." (tok/s) |
| Error rate / Total errors | Errors in the selected period. |
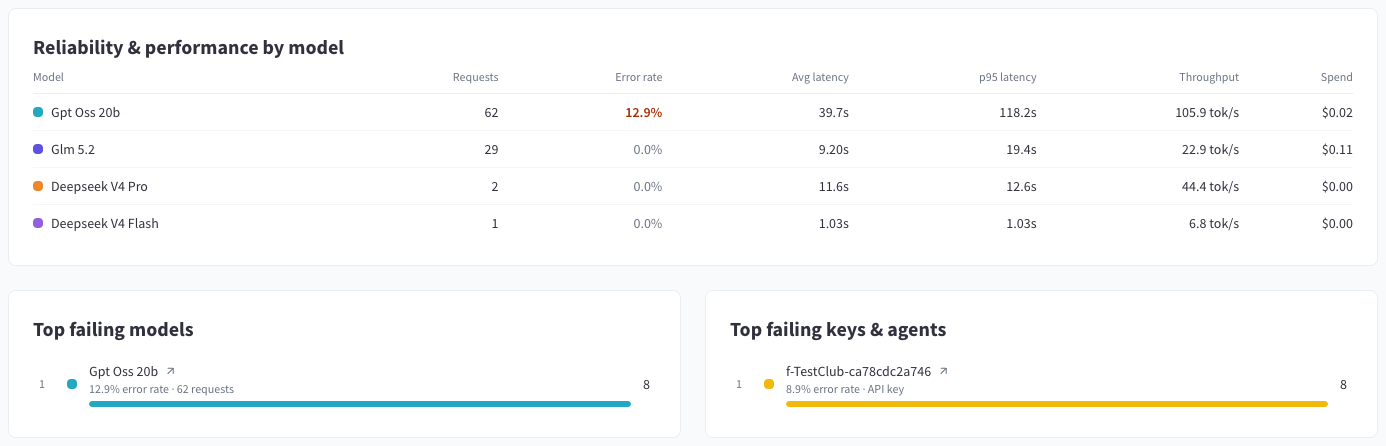
Figure 6: Reliability & performance by model, with Top failing models and Top failing keys & agents
The per-model table (requests, error rate, average and p95 latency, throughput, spend) is the fastest way to spot a misbehaving model; the failing-entities lists point straight at what to investigate. With no failures you'll see "No errors in this period".
Explore
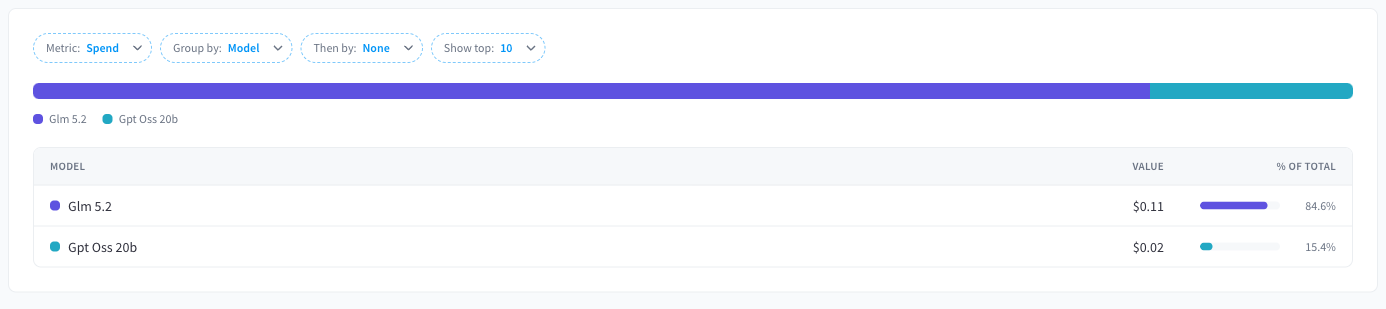
Figure 7: Explore — a pivot over your usage with Metric, Group by, Then by, and Show top controls
Explore is a free-form pivot: choose a Metric (e.g. Spend), Group by (Model, API key / agent, Source, Provider, Status), optionally nest with Then by, and cap the list with Show top. The result is a ranked breakdown with Value and % of Total. Row actions let you Apply filters based on this model (or key/agent) and jump to View in logs.
Exporting activity data
Click Export to open the export dialog:
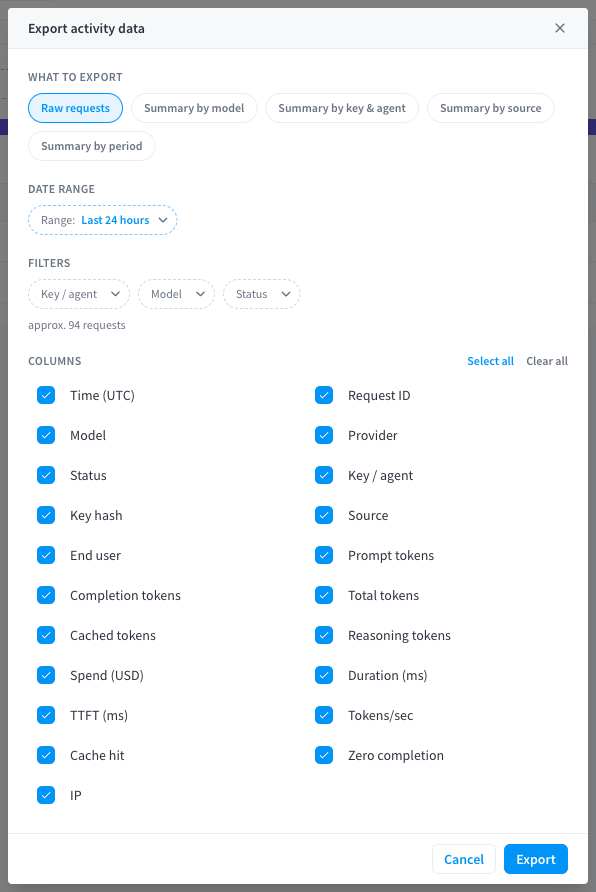
Figure 8: Export activity data — what to export, date range, filters, and column selection
- What to export: Raw requests (one CSV row per request) or a summary — Summary by model, Summary by key & agent, Summary by source, Summary by period.
- Date range and filters: the current view's range and filters carry over and can be adjusted. The dialog shows the approximate row count ("approx. … requests"); raw exports are capped at 25,000 rows ("export is capped at 25,000" appears when the range exceeds it).
- Columns: for raw exports, pick from Time (UTC), Request ID, Model, Provider, Status, Key / agent, Key hash, Source, End user, Prompt/Completion/Total/Cached/Reasoning tokens, Spend (USD), Duration (ms), TTFT (ms), Tokens/sec, Cache hit, Zero completion, and IP — with Select all / Clear all.
Note for summaries: "Summaries cover whole days, so a sub-day or graph selection is widened to full days." and "The search text is not applied to summaries."
The Logs tab
The Logs tab is the request-by-request audit trail.
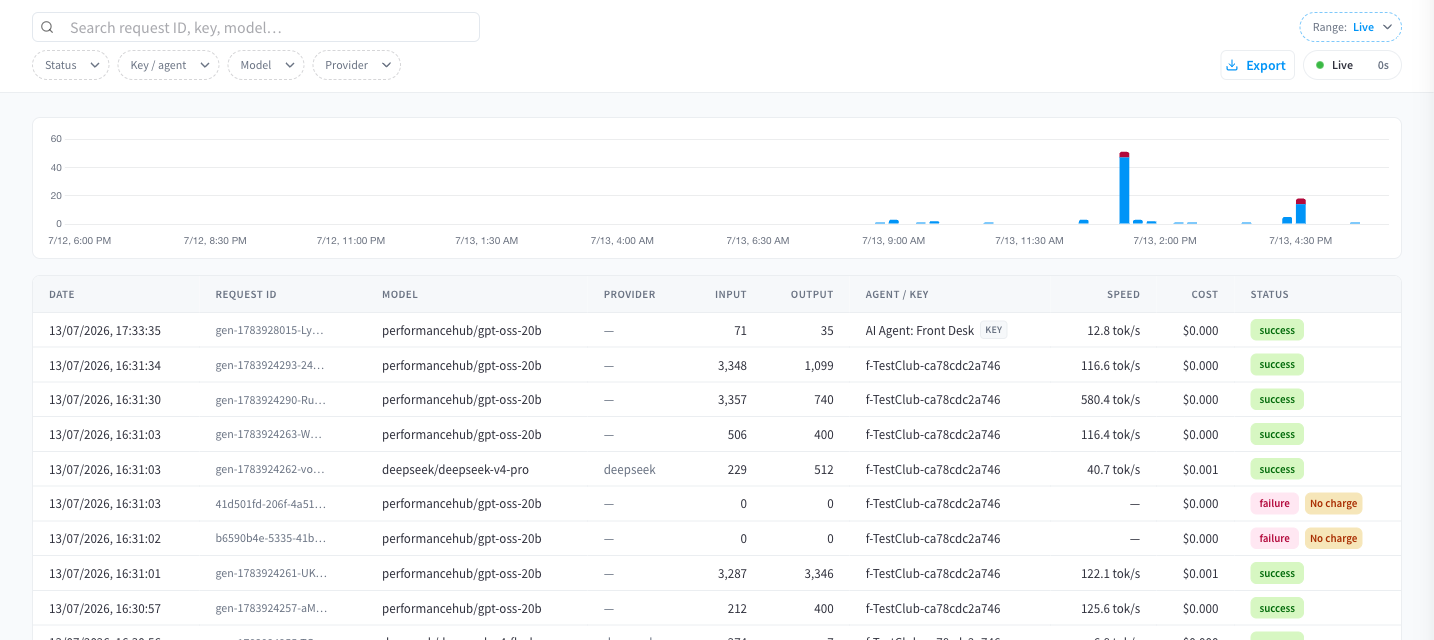
Figure 9: Logs — search, filters, the volume histogram, and the request table with live refresh
- Search ("Search request ID, key, model…") plus filters for Status (Success / Failed / All), Key / agent, Model, and Provider.
- Range presets include Live (auto-refreshing), Last 15 minutes, Last hour, Last 24 hours, and longer ranges. In Live mode a refresh countdown runs in the header; Refresh now forces one.
- The histogram shows request volume over the range (errors highlighted); drag-select a region of it to zoom the table to that window ("Showing logs for …", with Clear selection).
- Export opens the same export dialog as Activity, pre-set to raw request logs.
Each row shows date, request ID, model, provider, input and output tokens, agent/key, speed (tok/s), cost, and status (success / failure). A No charge badge marks failed or empty responses that cost nothing. An empty result shows "No requests yet." or "No requests match your filters."
Request details
Click a row to open the Request details drawer:
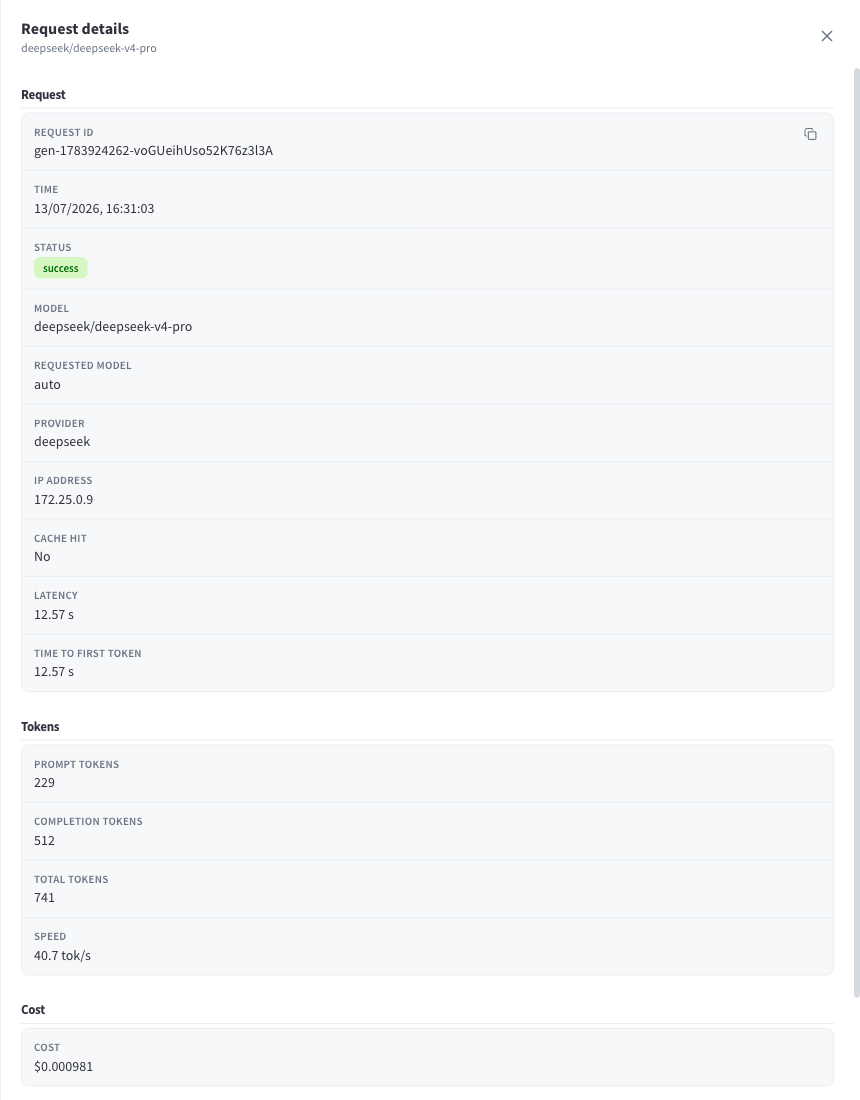
Figure 10: Request details — request metadata, token counts, and cost
| Section | Fields |
|---|---|
| Request | Request ID (copyable), Time, Status, Model (the model that served the request), Requested model (e.g. auto when the Auto Router chose the model), Provider, IP address, Cache hit, Latency, Time to first token. |
| Tokens | Prompt tokens, Completion tokens, Total tokens, Speed — plus Cached tokens (read/write) and Reasoning tokens when present. |
| Cost | The exact cost of the request. |
| Source / End user | Whether an API key or an agent made the call, and the end-user identifier if the caller supplied one. |
There is deliberately no prompt or response content anywhere in the logs.