Dashboard
The Dashboard is the default landing page when you log in to Performance Hub. It provides a real-time view of your facility's activity, member compliance status, and trend data for the selected time period.
Search

The Search Performance Hub bar, located at the top centre of every page, provides quick access to the Performance Hub Knowledge Base — internal documentation covering features, workflows, and platform guidance.
To open the search bar using a keyboard shortcut:
⌘K   (Mac)
Ctrl+K   (Windows / Linux)
Type a keyword or question to search across the Knowledge Base. Results appear inline and link directly to the relevant documentation.
Note: The Knowledge Base search returns internal Performance Hub documentation only. It does not search your facility's data, members, or device records.
The bell icon to the right of the search bar is the Notifications panel. Click it to view recent system alerts and activity for your facility, such as device status changes and automated schedule events. Click View All to see the full notification history.
Facility bar

The facility bar sits directly below the top navigation and provides at-a-glance context for the currently selected location.
| Element | Description |
|---|---|
| Facility name | The active facility (e.g. Morningside) and its parent organisation (e.g. Total Fusion) |
| Last updated | Timestamp showing when the dashboard data was last refreshed |
| Weather | Current conditions at the facility location — temperature and description |
| Humidity | Current humidity percentage |
| Wind speed | Current wind speed in km/h |
| Sunrise / Sunset | Today's sunrise and sunset times for the facility location |
Note: Weather data reflects the facility's geographic location and updates automatically.
Summary cards
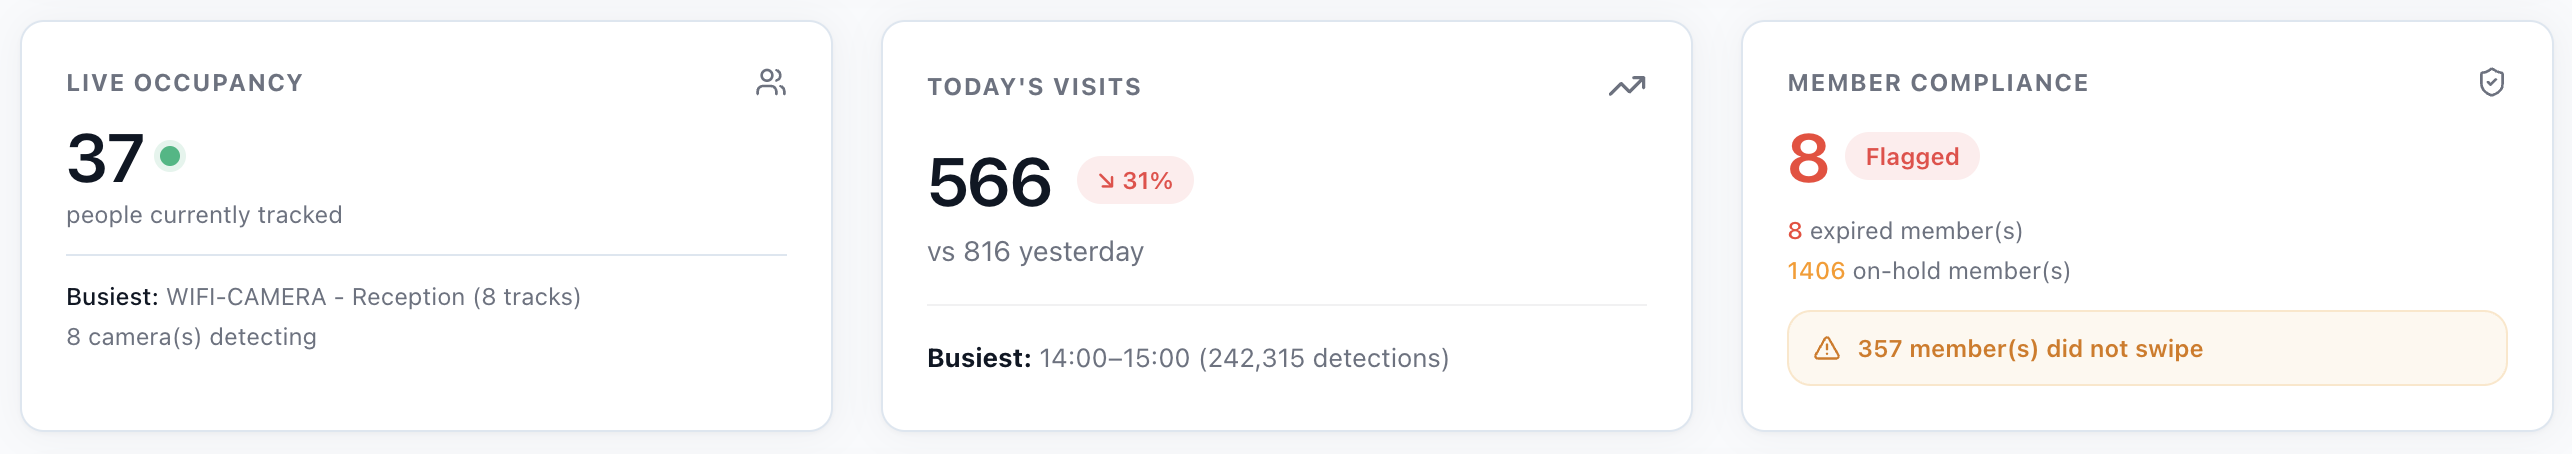
Three summary cards sit below the facility bar and provide the most critical metrics for your facility at a glance.
-
Live Occupancy
Displays the number of people currently detected inside the facility by the AI tracking system.
Element Description Count Total number of people currently tracked, shown with a live green indicator Busiest zone The zone with the most active camera tracks right now Cameras detecting Number of cameras actively contributing to the occupancy count -
Today's Visits
Displays the total number of AI-detected visits for the current day.
Element Description Count Total visits detected today vs yesterday Percentage change compared to the same facility yesterday, shown as a red (decrease) or green (increase) badge Busiest hour The one-hour window with the highest detection volume today, including the detection count -
Member Compliance
Displays the number of flagged member access events that require attention.
Element Description Flagged count Total number of members with a compliance issue (shown in red when non-zero) Expired members Members whose membership has expired but who have accessed the facility On-hold members Members currently on hold who have accessed the facility Did not swipe Members detected by AI cameras who did not register an entry via the access system
Warning: Member compliance flags are not automatically resolved. Review flagged members regularly to maintain accurate access records.
Overview
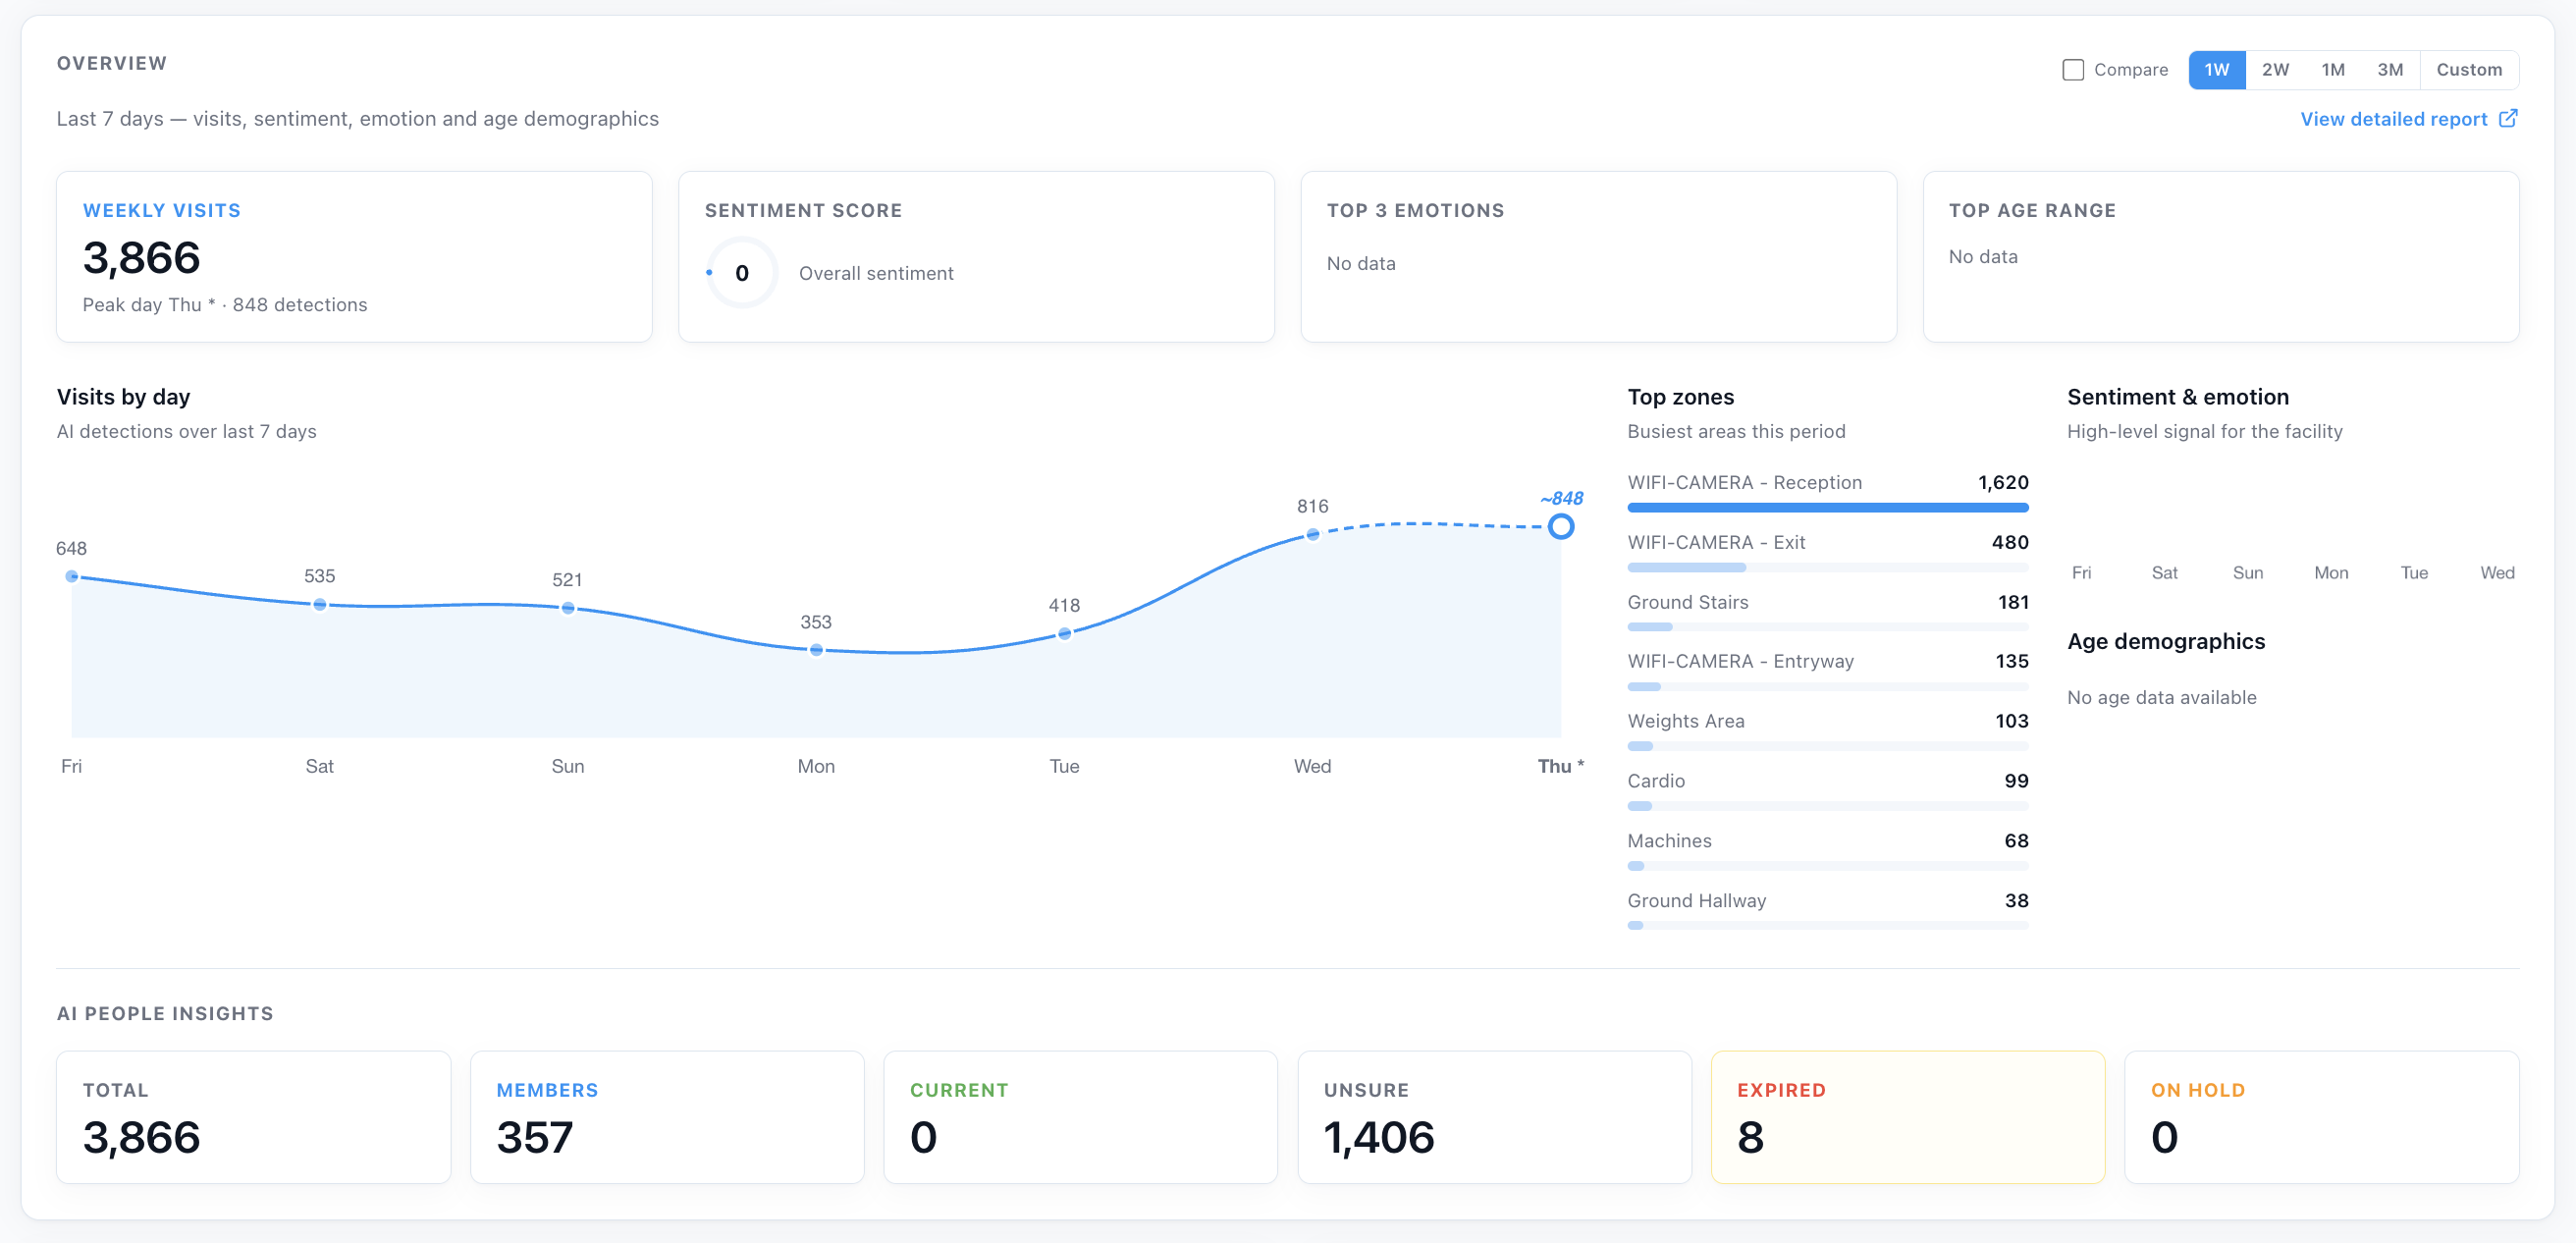
The Overview panel shows aggregate trend data for the facility across a selected time period. Use it to understand visit patterns, member sentiment, and demographic breakdowns over time. You may click through the blue tabs at the top right of the overview section to change the Club Performance overview to 1 Week, 2 Weeks, 1 Month or a Custom time period.
Click View detailed report to open a full breakdown in the AI Insights & People section. This link navigates to the Club Insights & Performance report within AI Insights & People — a dedicated section that provides deeper analysis of visit trends, sentiment data, and member demographics. See AI Insights & People for full documentation on that section.
Overview Deeper Insights
- Time period selector — Select a time window using the controls in the top-right of the panel: 1W (last 7 days), 2W (last 14 days), 1M (last 30 days), 3M (last 90 days), or Custom (define a specific start and end date). Select Compare to overlay a previous equivalent period for side-by-side comparison.
- Metrics — Displays Weekly Visits (total AI-detected visits for the period), Sentiment Score (overall emotional tone rating), Top 3 Emotions (most frequently detected emotions), and Top Age Range (most common age bracket detected).
- Visits by day — A bar chart showing daily AI detection counts across the selected period. Hover over a bar to see the exact count for that day. Use this to identify peak days, quiet periods, and week-on-week patterns.
- Top zones — Lists the busiest areas within the facility for the selected period, ranked by total detection count. Zone names correspond to the camera locations configured in Device Management.
- Sentiment & emotion — A high-level signal showing the overall emotional tone detected at the facility during the period, derived from AI analysis of facial expressions captured by tracking cameras.
Note: Sentiment and emotion data requires sufficient detection volume to produce meaningful results. Facilities with limited camera coverage or low foot traffic may show "No data" for these metrics.
AI People Insights
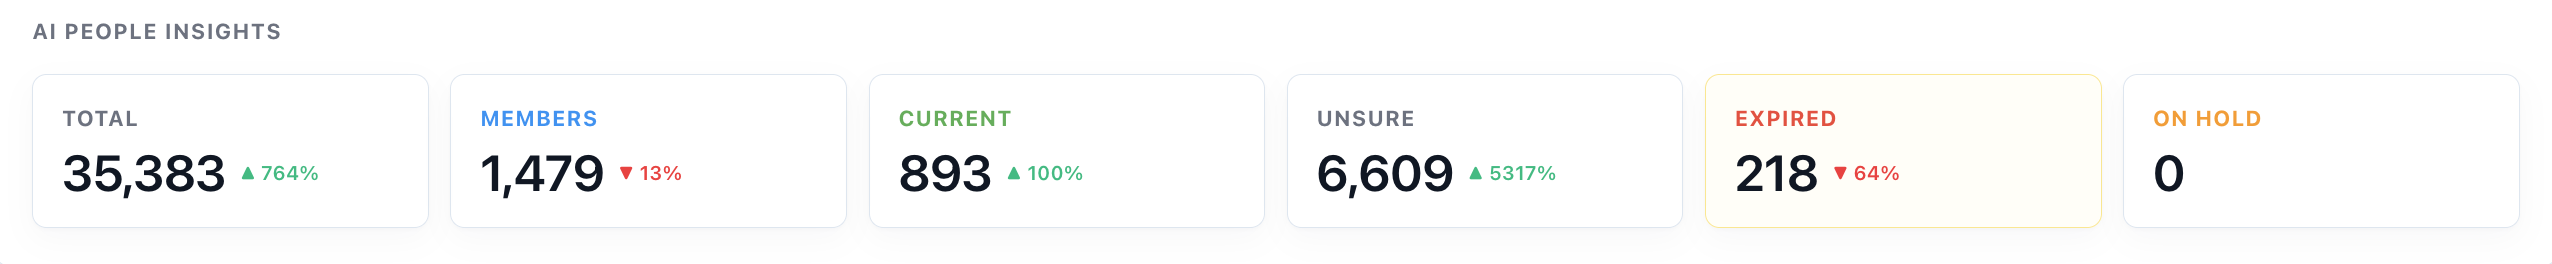
The AI People Insights panel provides a real-time snapshot of your current membership and access activity across the facility.
| Metric | Description |
|---|---|
| Total | Total number of AI-detected visits for the current period |
| Members | Number of detected individuals who did not register an entry via the access system |
| Current | Members currently inside the facility |
| Unsure | Members whose access status could not be confirmed |
| Expired | Members whose membership has expired but have accessed the facility |
| On Hold | Members currently on hold who have accessed the facility |
Click View All to open the full AI Insights & People section for deeper analysis.
Edge AI Processor
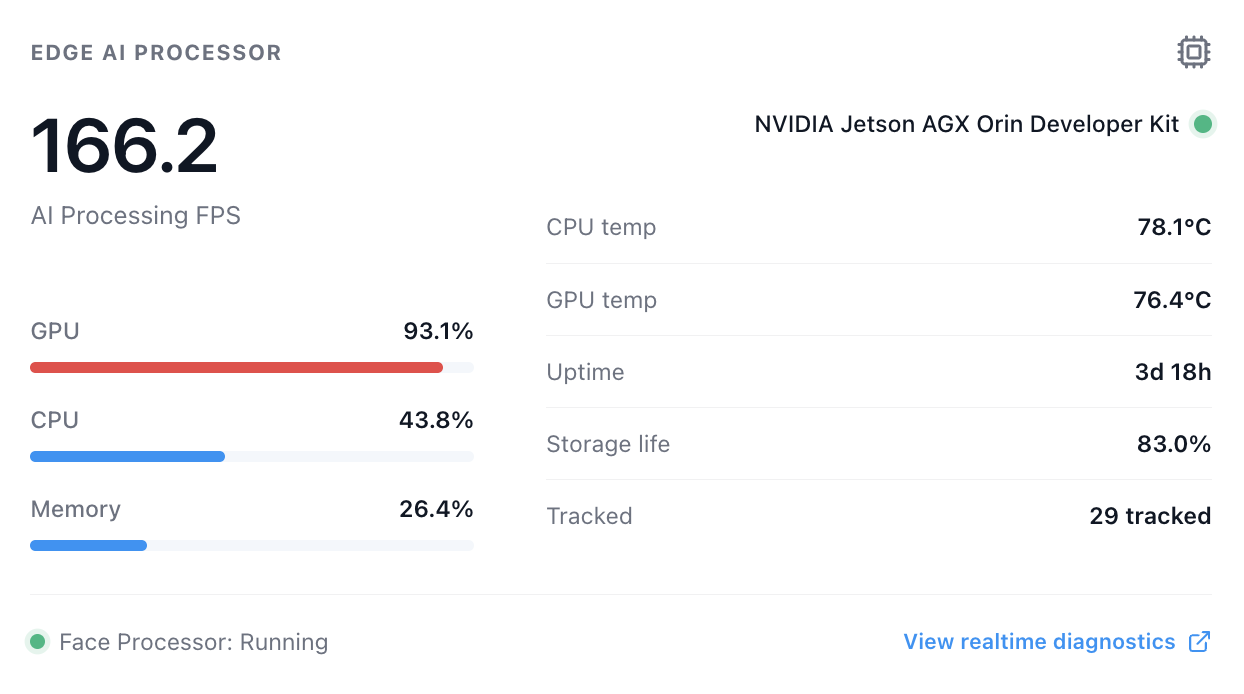
The Edge AI Processor panel displays the real-time status of the on-site AI hardware unit (typically an NVIDIA Jetson AGX Orin Developer Kit) responsible for running AI camera processing, face detection, and occupancy tracking.
| Metric | Description |
|---|---|
| AI Processing FPS | Frames per second currently being processed by the edge AI unit |
| GPU usage | Current GPU utilisation percentage |
| CPU usage | Current CPU utilisation percentage |
| Memory usage | Current memory utilisation percentage |
| CPU temp | Current CPU temperature in °C |
| GPU temp | Current GPU temperature in °C |
| Uptime | How long the edge processor has been running since last restart |
| Storage life | Estimated remaining storage life as a percentage |
| Tracked | Number of individuals currently being tracked by the AI system |
| Face Processor | Status of the face recognition process (Running / Stopped) |
Click View realtime diagnostics to open a detailed diagnostic view of the edge processor.
Cameras
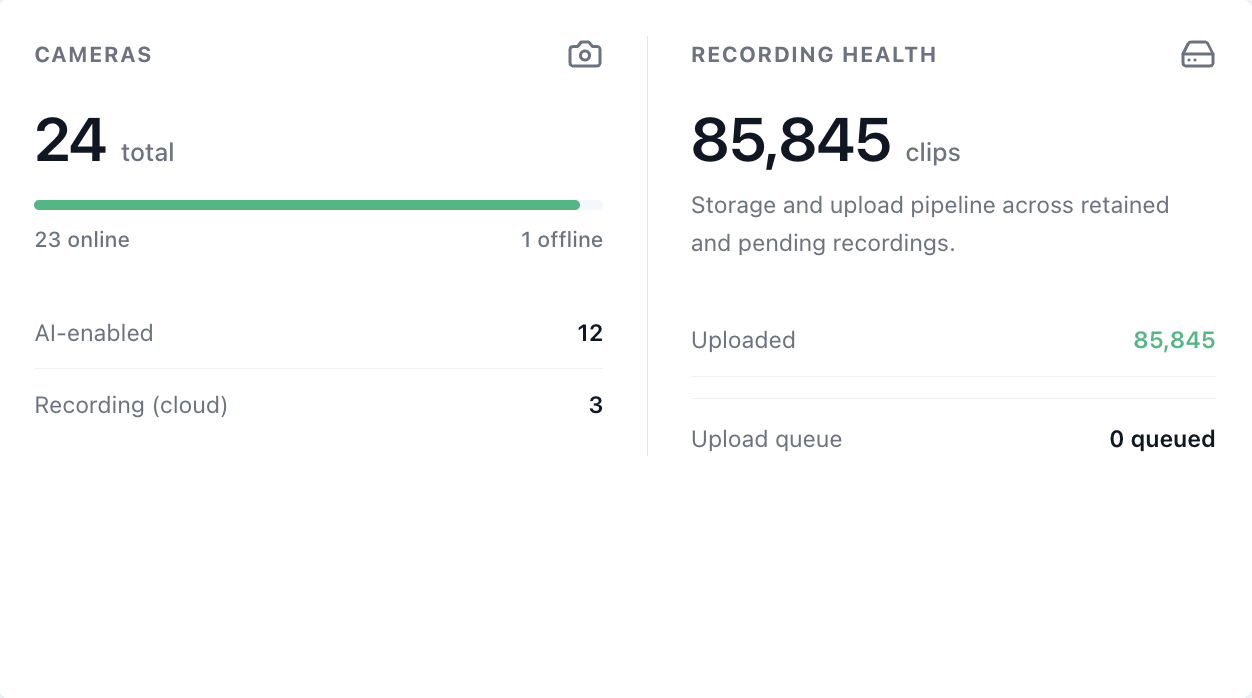
The Cameras panel shows the overall status of all connected cameras at the facility.
| Metric | Description |
|---|---|
| Total | Total number of cameras configured at the facility |
| Online | Number of cameras currently connected and active |
| Offline | Number of cameras that are not responding |
| AI-enabled | Number of cameras with AI processing active |
| Recording (cloud) | Number of cameras currently uploading recordings to cloud storage |
| Tracked | Total number of individuals currently being tracked across all cameras |
The panel also displays Recording Health, showing total stored clips, upload pipeline status, uploaded count, and upload queue depth.
Warning: If cameras show as offline, navigate to Device Management to investigate. Offline cameras will create gaps in occupancy data and recording history.
Camera Status
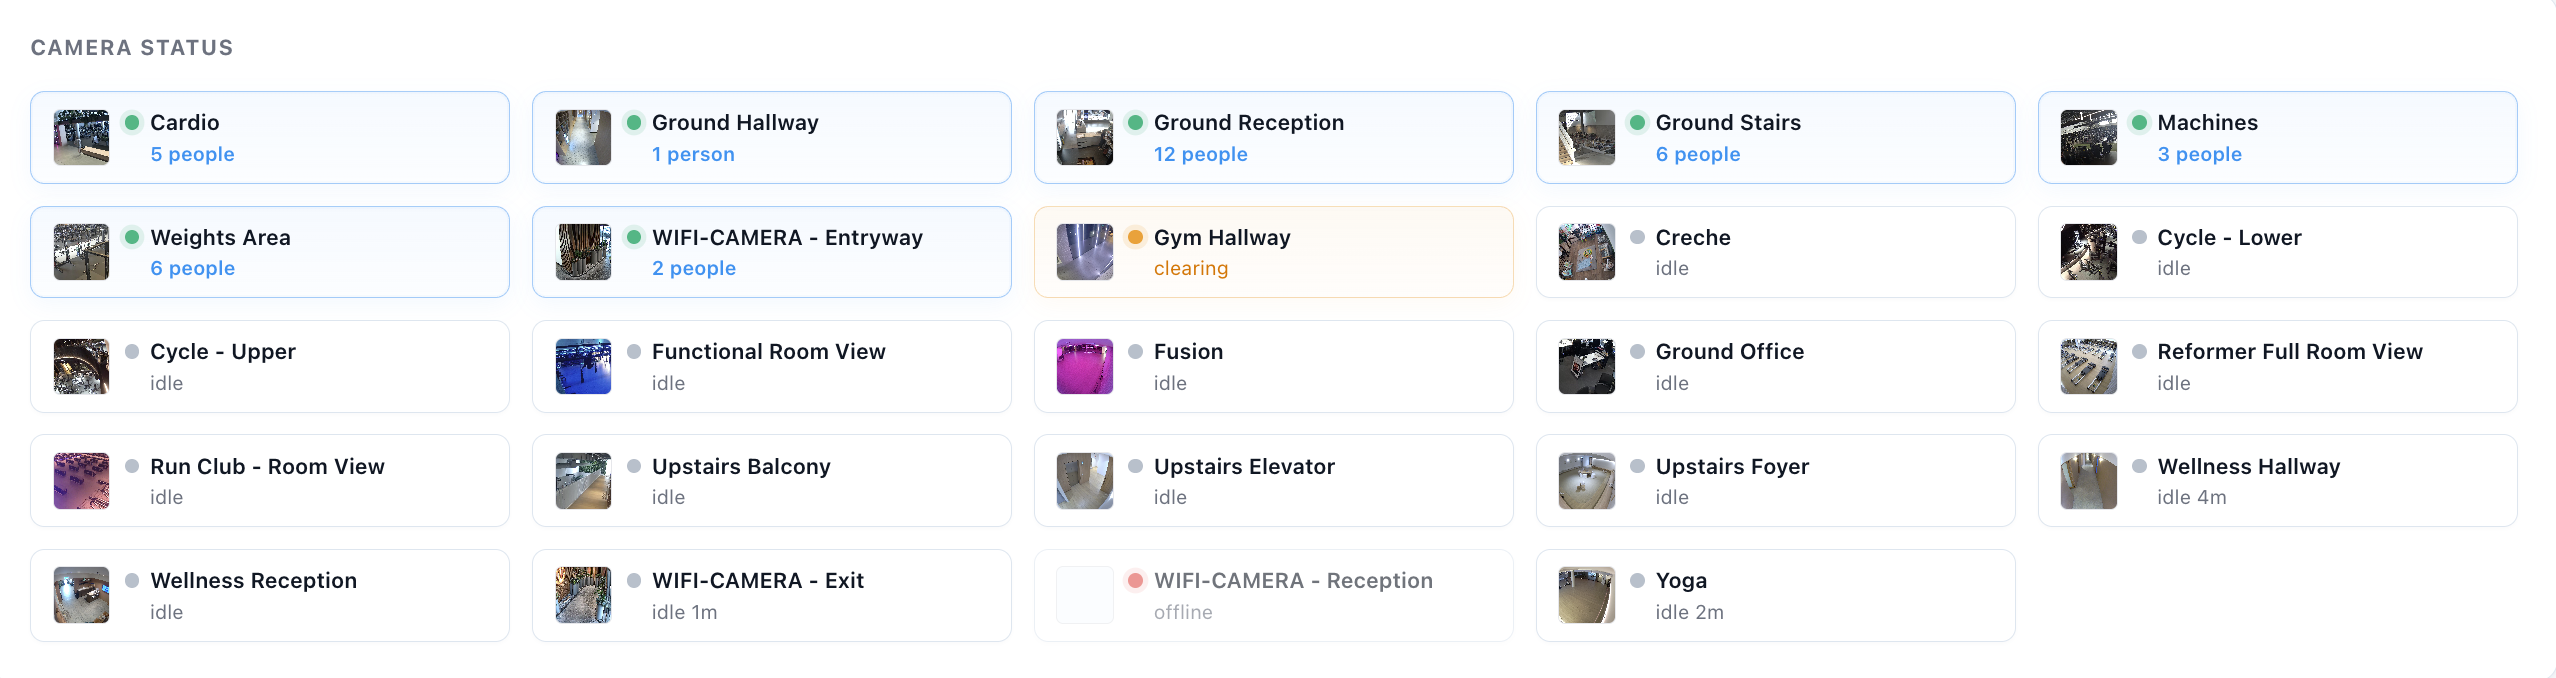
The Camera Status panel displays a live thumbnail grid of all cameras at the facility, showing real-time activity at a glance.
Each camera tile shows:
- The camera name and location
- A live thumbnail image
- The number of people currently detected in frame
- Whether the camera is active (detecting people) or idle
- An offline indicator (red dot) if the camera is not connected
Click View All to open the full camera list in the CCTV section.
Network & Infrastructure
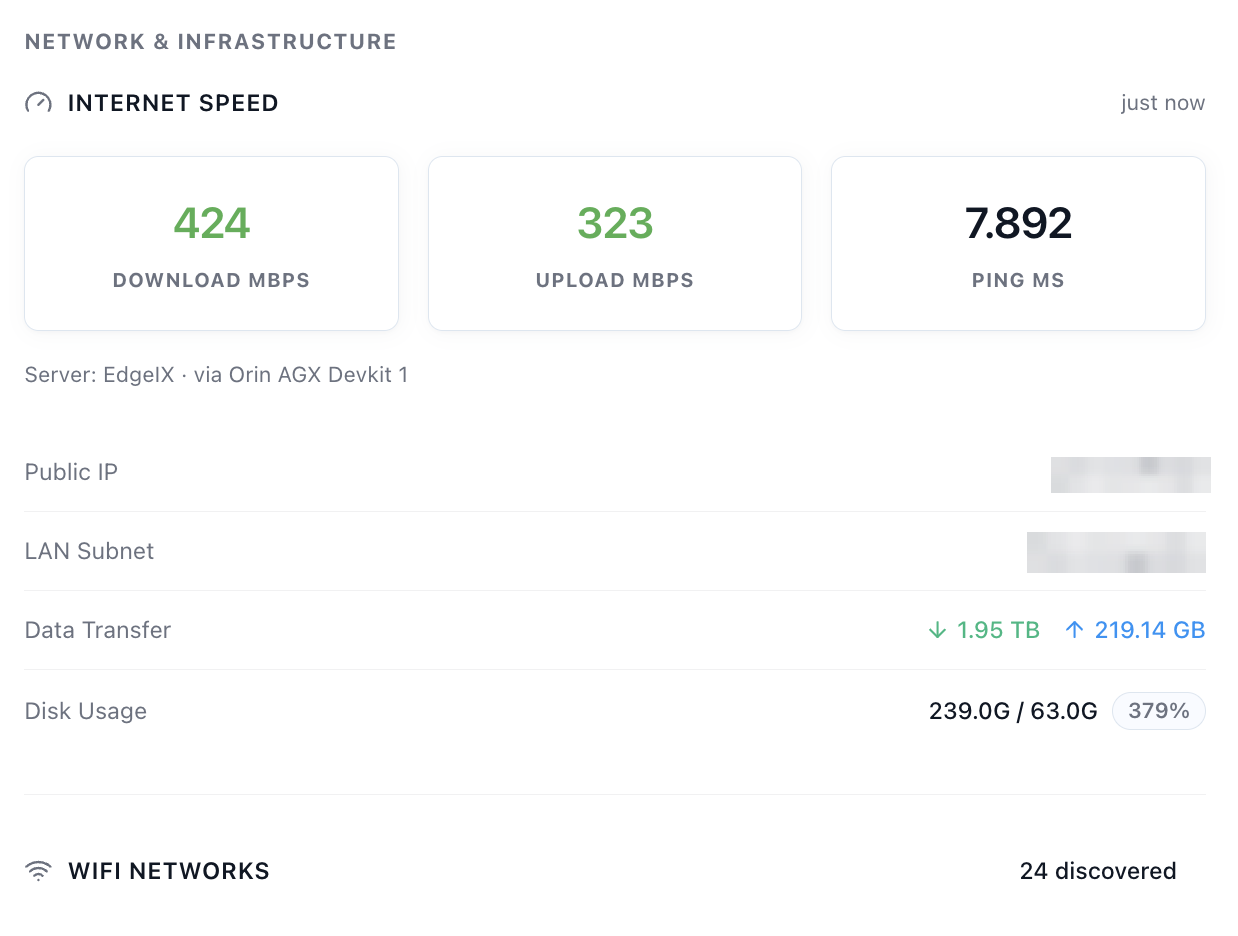
The Network & Infrastructure panel displays the real-time network and server status for the facility, sourced from the on-site edge processor.
Internet Speed
| Metric | Description |
|---|---|
| Download Mbps | Current download speed at the facility |
| Upload Mbps | Current upload speed at the facility |
| Ping ms | Current network latency in milliseconds |
Server Details
| Field | Description |
|---|---|
| Server | The on-site server routing traffic (e.g. EdgeIX via Orin AGX Devkit) |
| Public IP | The facility's current public IP address |
| LAN Subnet | The local area network subnet in use |
| Data Transfer | Total inbound and outbound data transferred |
| Disk Usage | Current disk usage on the edge processor (used / total, percentage) |
| WiFi Networks | Number of WiFi networks discovered in range of the facility |
Safety & Environment
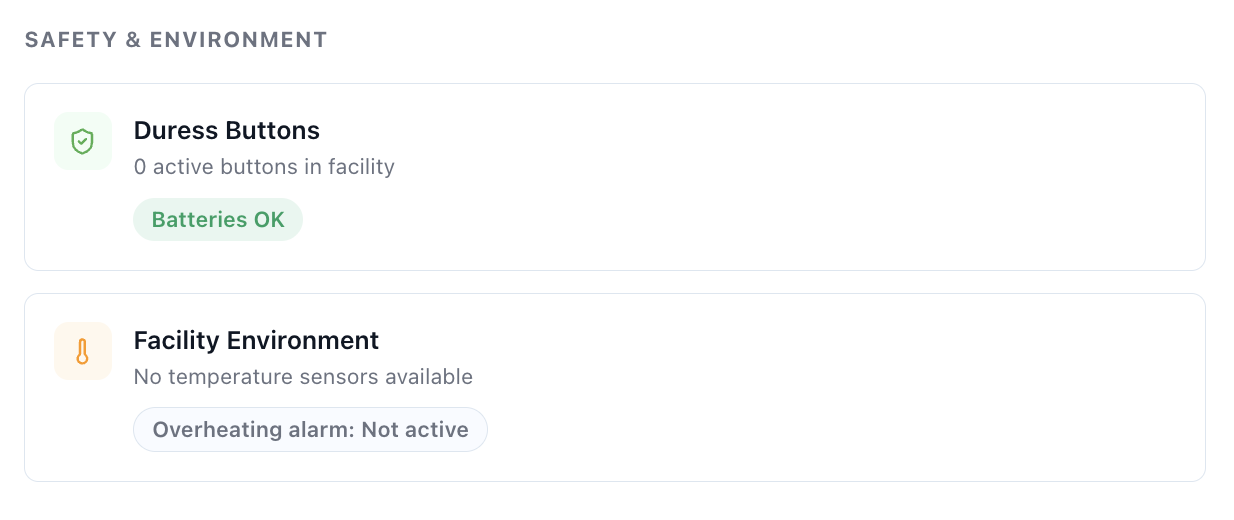
The Safety & Environment panel monitors critical safety hardware and environmental conditions at the facility.
Duress Buttons
Displays the number of active duress (panic) buttons installed at the facility and their battery status.
| Status | Description |
|---|---|
| Batteries OK | All duress buttons have sufficient charge |
| Battery warning | One or more buttons have low battery and require charging |
Warning: Low battery on duress buttons is a critical issue. Replace or recharge affected units immediately.
Facility Environment
Displays temperature sensor data from connected climate monitoring devices.
| Field | Description |
|---|---|
| Temperature sensors | Current readings from connected sensors, or a message if none are configured |
| Overheating alarm | Indicates whether an overheating threshold has been triggered |