Timeline
The Timeline tab gives you a real-time gantt view of every person detected across your facility's cameras for the selected time period. Each row represents a detected individual, and the horizontal bars show when and for how long they were detected. Use this to understand occupancy patterns, track individual movement, and investigate specific incidents.
Filter bar

| Element | Description |
|---|---|
| All | Total number of detected individuals in the selected period |
| Facility Members | Detected individuals successfully matched to a member profile |
| Current | Individuals currently detected in the facility |
| Unsure | Detections that could not be matched to a known member |
| Expired | Members whose membership has lapsed |
| On Hold | Profiles currently on hold |
| Card Sharing | Detections flagged as potential card sharing |
| Tailgating | Detections flagged as potential tailgating |
| Search | Search for a specific person by name or ID |
Use the Sort By dropdown to order results (default: Last Seen). Use the filter icon to apply additional filters, and the export icon to export the current view.
Date and time range
The date/time selector at the top right controls the period shown on the timeline. Click the calendar icon to change the date or time window (e.g. Thu 7 May 6:35 AM – 3:18 PM).
Use the 1D / 2D / 3D buttons to switch between one, two, or three day views, or adjust the zoom level.
Timeline rows
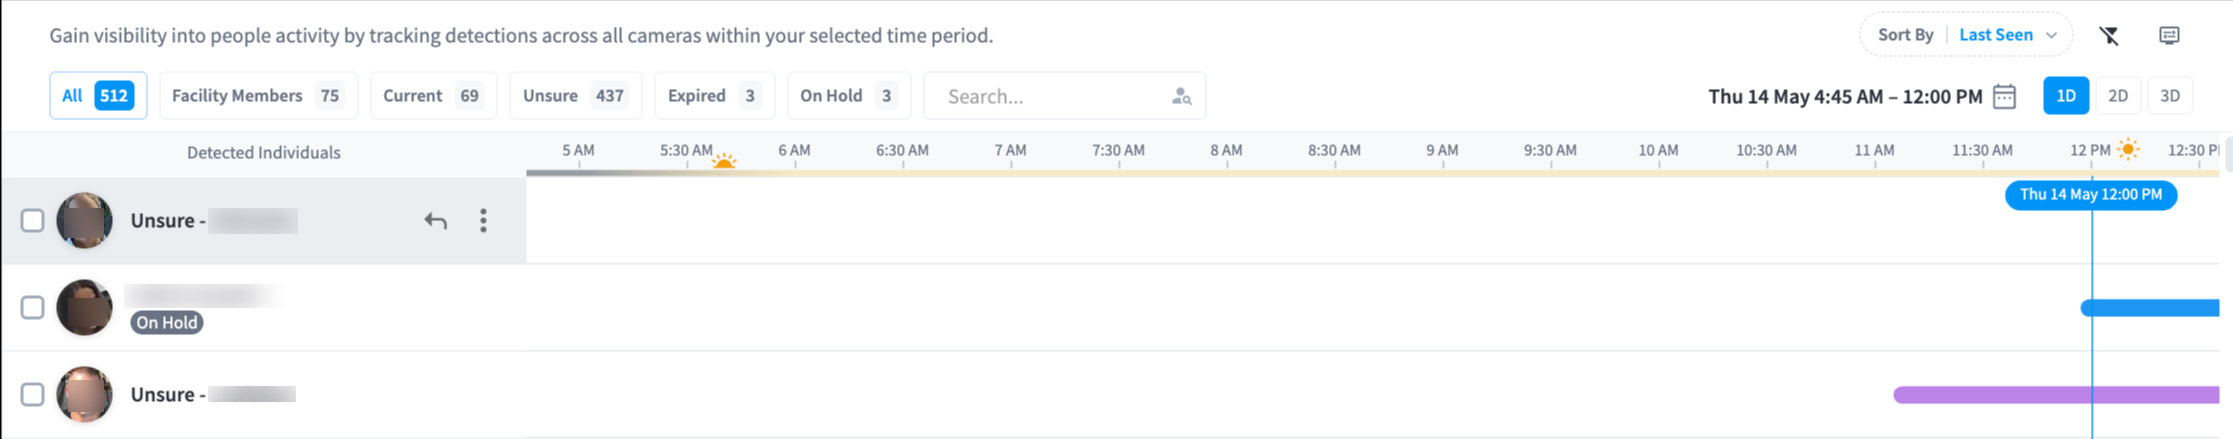
Each row represents a detected individual and shows:
| Element | Description |
|---|---|
| Profile photo | Thumbnail of the detected person's face |
| Name / ID | Member name (if matched) or an anonymous ID (e.g. Unsure - 7ccb6b3e) |
| Status | Active (linked to a member profile) or unlabelled (unidentified) |
| Detection bar | A horizontal bar showing the time span of the detection |
| Dot | A single point detection — a brief sighting at that time |
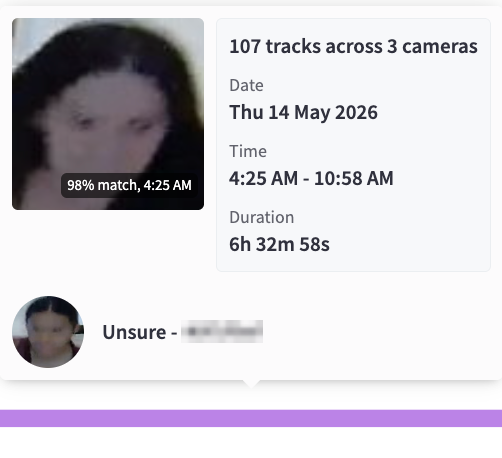
Touch or mouse over any detection bar or dot to display further information about the track.
Colour coding:
| Colour | Meaning |
|---|---|
| Blue | Facility member (Active profile) |
| Purple | Unsure — unidentified individual |
A vertical line marked with the current time (e.g. Thu 07 May 3:18 PM) tracks across the chart in real time.
Row actions
Hovering over a row reveals two action icons:
| Icon | Action |
|---|---|
| Reply / link icon | Navigate to this person's profile or linked footage |
| ... menu | Additional options for this detection: - Copy Person ID - Merge with another profile - Identify This Person - Delete this Person |
Further AI Insights per tracked individual
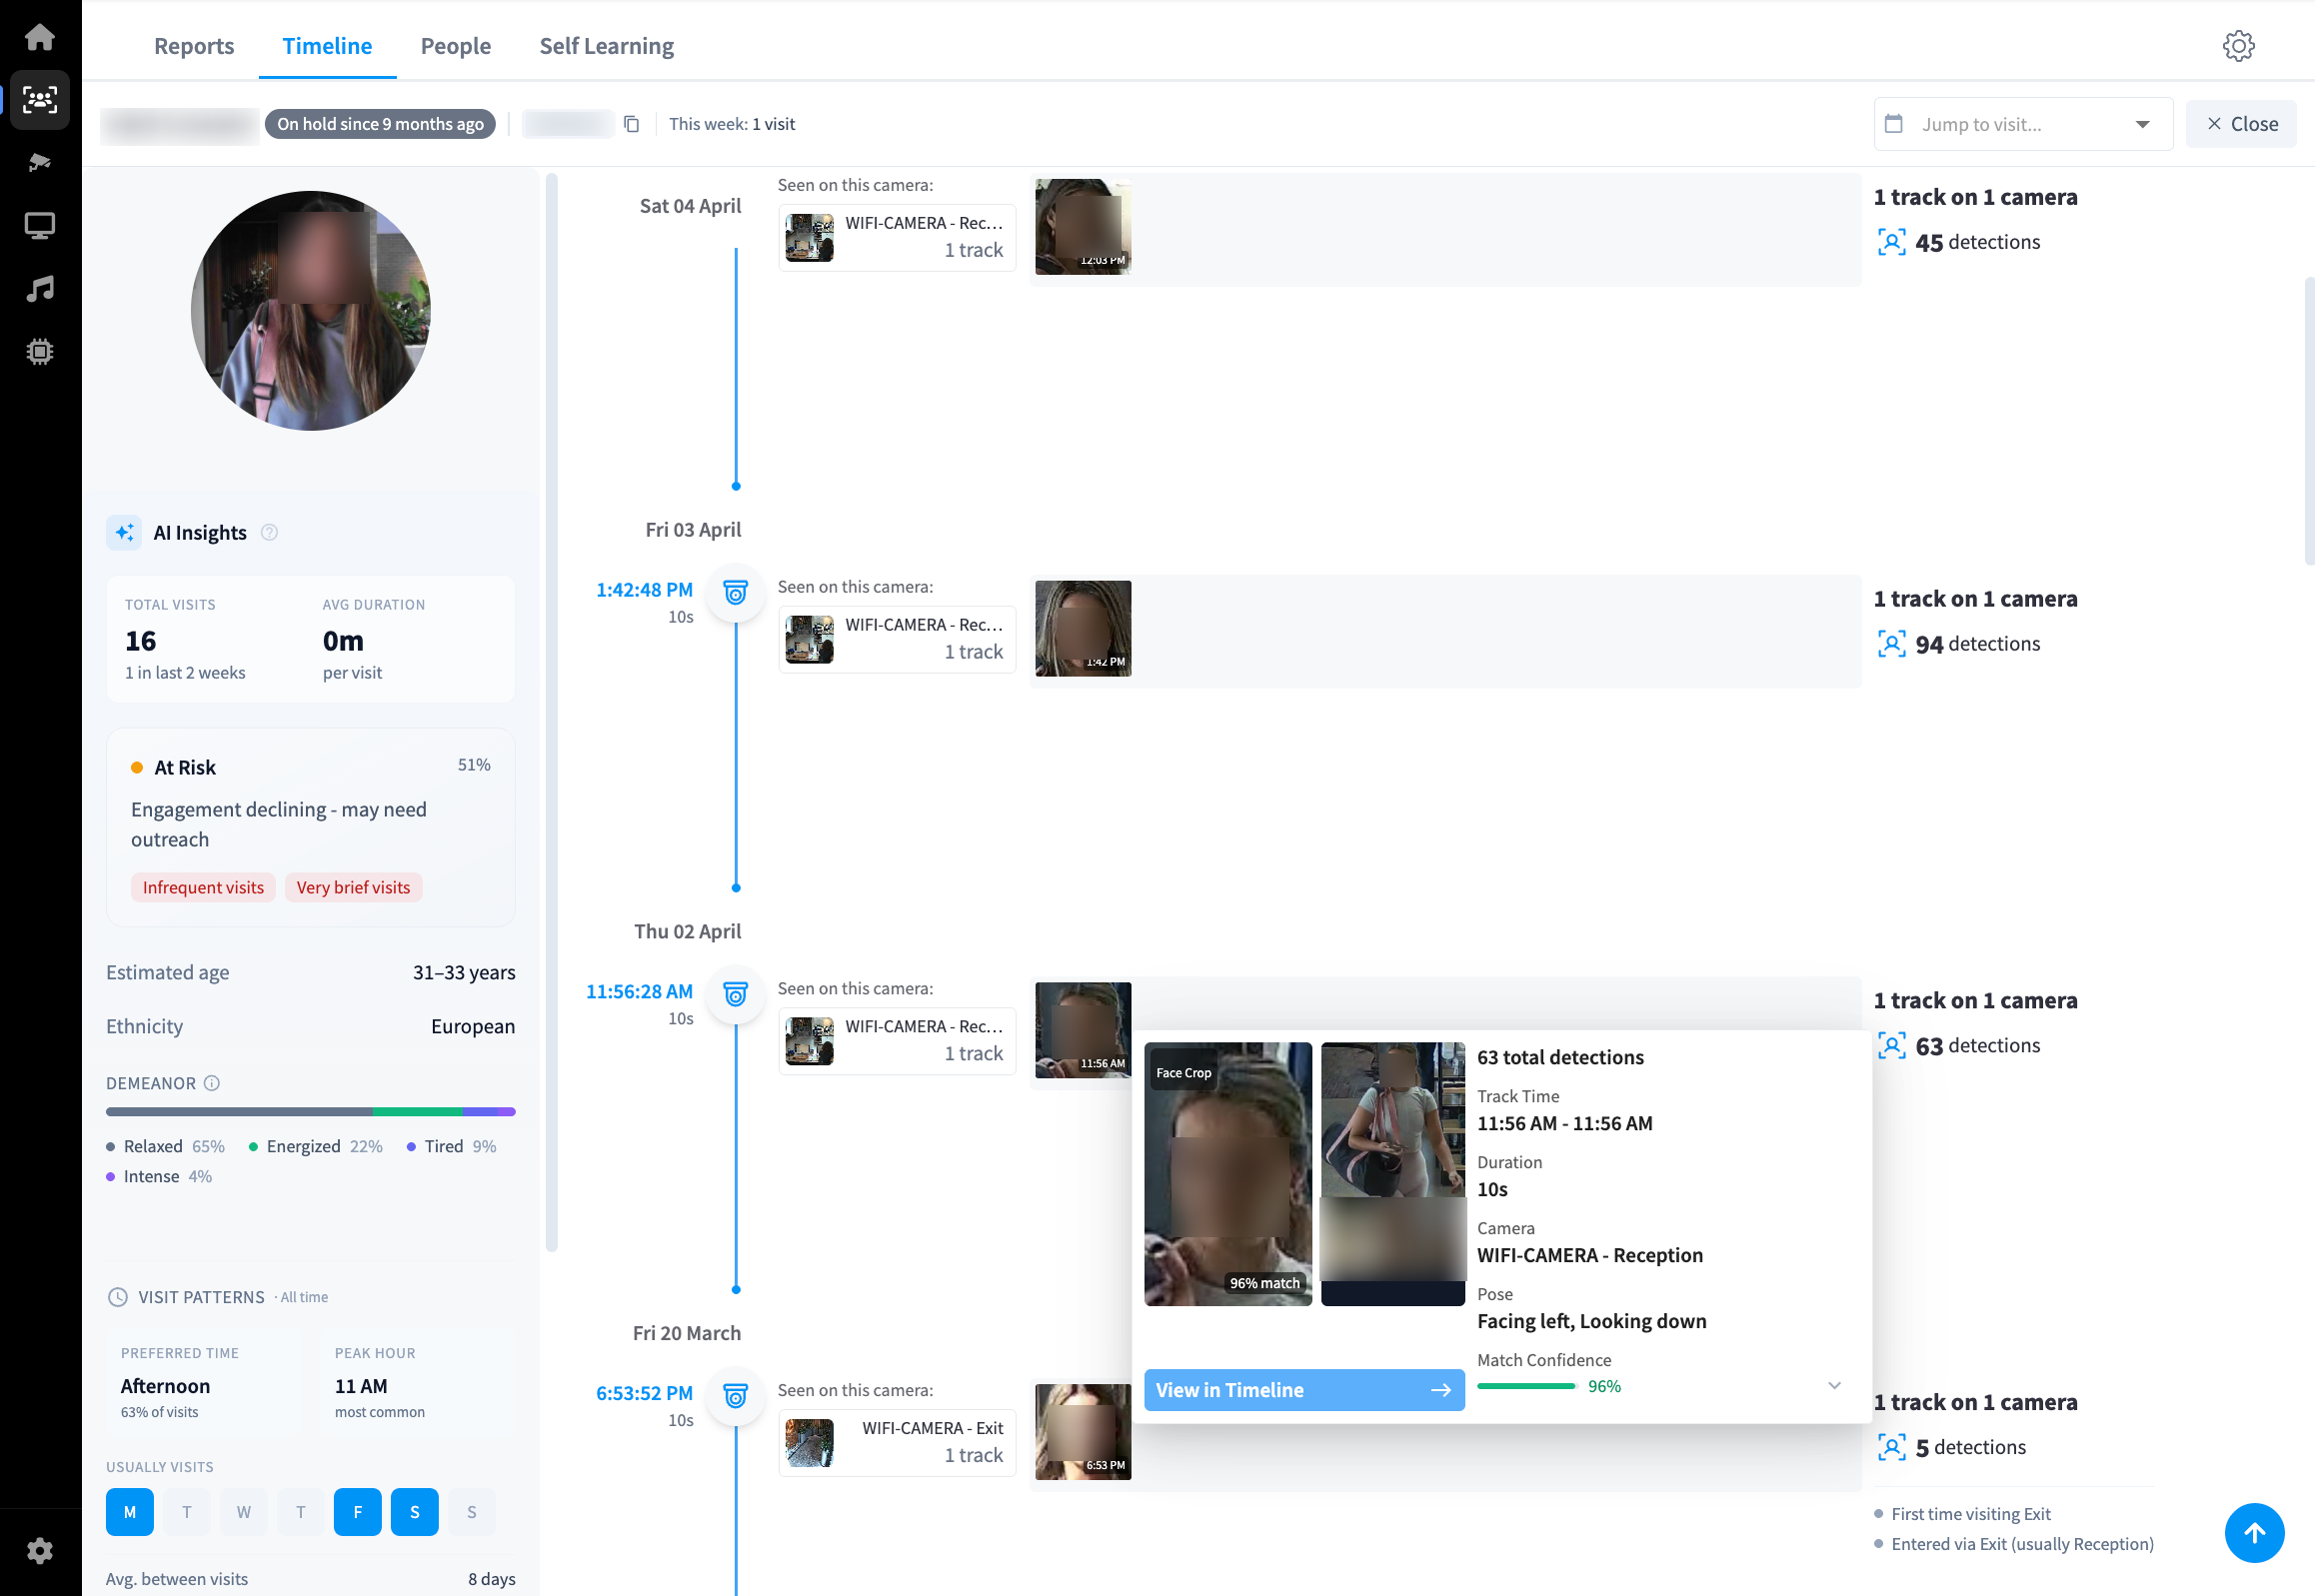
Selecting or clicking on a detected individual in the timeline opens a side panel with detailed AI-generated insights specific to that person. The panel is split into two columns: insight cards on the left, and a chronological visit log on the right.
Header
The top of the panel shows:
| Field | Description |
|---|---|
| Name | Member's full name (if matched to a profile) |
| Membership status | Active, Expired, On Hold, or similar |
| Person ID | A unique identifier for this detection profile, with a Copy ID button |
| This week | Number of visits recorded in the current week |
| Jump to visit | Dropdown to navigate directly to a specific visit date |
| Open | Opens the full profile view for this person |
| Close | Dismisses the panel |
AI Insights card
The AI Insights card summarises Performance Hub's analysis of the individual's engagement and characteristics.
| Field | Description |
|---|---|
| Total Visits | Cumulative number of detected visits, with a "last 2 weeks" count shown below |
| Avg Duration | Average time spent in the facility per visit |
| Engagement score | A label (e.g. At Risk, Engaged, Loyal) paired with a percentage score and a short description. Tags below identify contributing factors such as "Decreasing engagement" or "Very brief visits" |
| Estimated age | AI-estimated age range for the individual (e.g. 35–37 years) |
| Ethnicity | AI-estimated ethnicity |
| Demeanor | A percentage breakdown of detected emotional states across visits — categories include Relaxed, Intense, Energized, Tired, and Focused |
Note: Age, ethnicity, and demeanor fields are AI estimates derived from facial analysis. They are provided as contextual data only and should not be used as the basis for individual decisions.
Visit Patterns card
The Visit Patterns card shows behavioural trends derived from the individual's full detection history.
| Field | Description |
|---|---|
| Preferred Time | The time of day (e.g. Afternoon) when this person most commonly visits, and the percentage of visits that fall in that window |
| Peak Hour | The single hour with the highest visit frequency |
| Usually Visits | A day-of-week visual (M T W T F S S) highlighting the days they most commonly attend |
| Avg. between visits | Average number of days between visits |
| Current streak | How long the person has been visiting consistently (e.g. 2 weeks) |
| Longest absence | The longest recorded gap between visits |
| First detected | The date Performance Hub first detected this individual |
Location Insights card
The Location Insights card shows which areas of the facility the person frequents.
| Field | Description |
|---|---|
| Zone / camera | The camera zones where the person was detected, shown with a percentage of total visits |
| Avg time | Average time spent in each zone per visit |
| Entry summary | A plain-language summary of the person's most common entry point (e.g. "Usually enters via Reception (100% of visits)") |
Activity log
The right column of the panel shows a chronological log of every detected visit, grouped by date. Each entry includes:
| Field | Description |
|---|---|
| Date | The date of the visit |
| Time | Timestamp of the first detection in that session |
| Duration | Total tracked duration for that visit (e.g. 10s, 1m 56s) |
| Camera | The camera(s) that recorded this person, shown with a thumbnail and camera name |
| Tracks / detections | Number of detection tracks and total individual detections recorded across that visit |
Click any detection entry to jump to that moment in the timeline.
Mini-map
A scrollable mini-map at the bottom of the view shows the full day's timeline compressed into a navigation bar. Drag the highlighted region to pan through the timeline.
Related pages
- AI Insights & People — section overview
- People — member directory
- Reports — analytics and zone activity
- Self Learning — AI profile matching