Dashboard
Your Dashboard is the central hub for monitoring your facility's daily operations and performance. It brings together member activity, revenue tracking, bookings, customer reviews, and smart device monitoring in one convenient view.
Quick Reference
Where to find it: Main Menu → Dashboard (or click the Performance Hub logo)
Who can access: All users with facility access
Purpose: Real-time overview of facility operations and performance
What You'll See
The Dashboard combines information from multiple sources to give you a complete picture of how your facility is performing. Think of it as your facility's health check—a quick scan tells you what's happening right now and how it compares to recent performance.
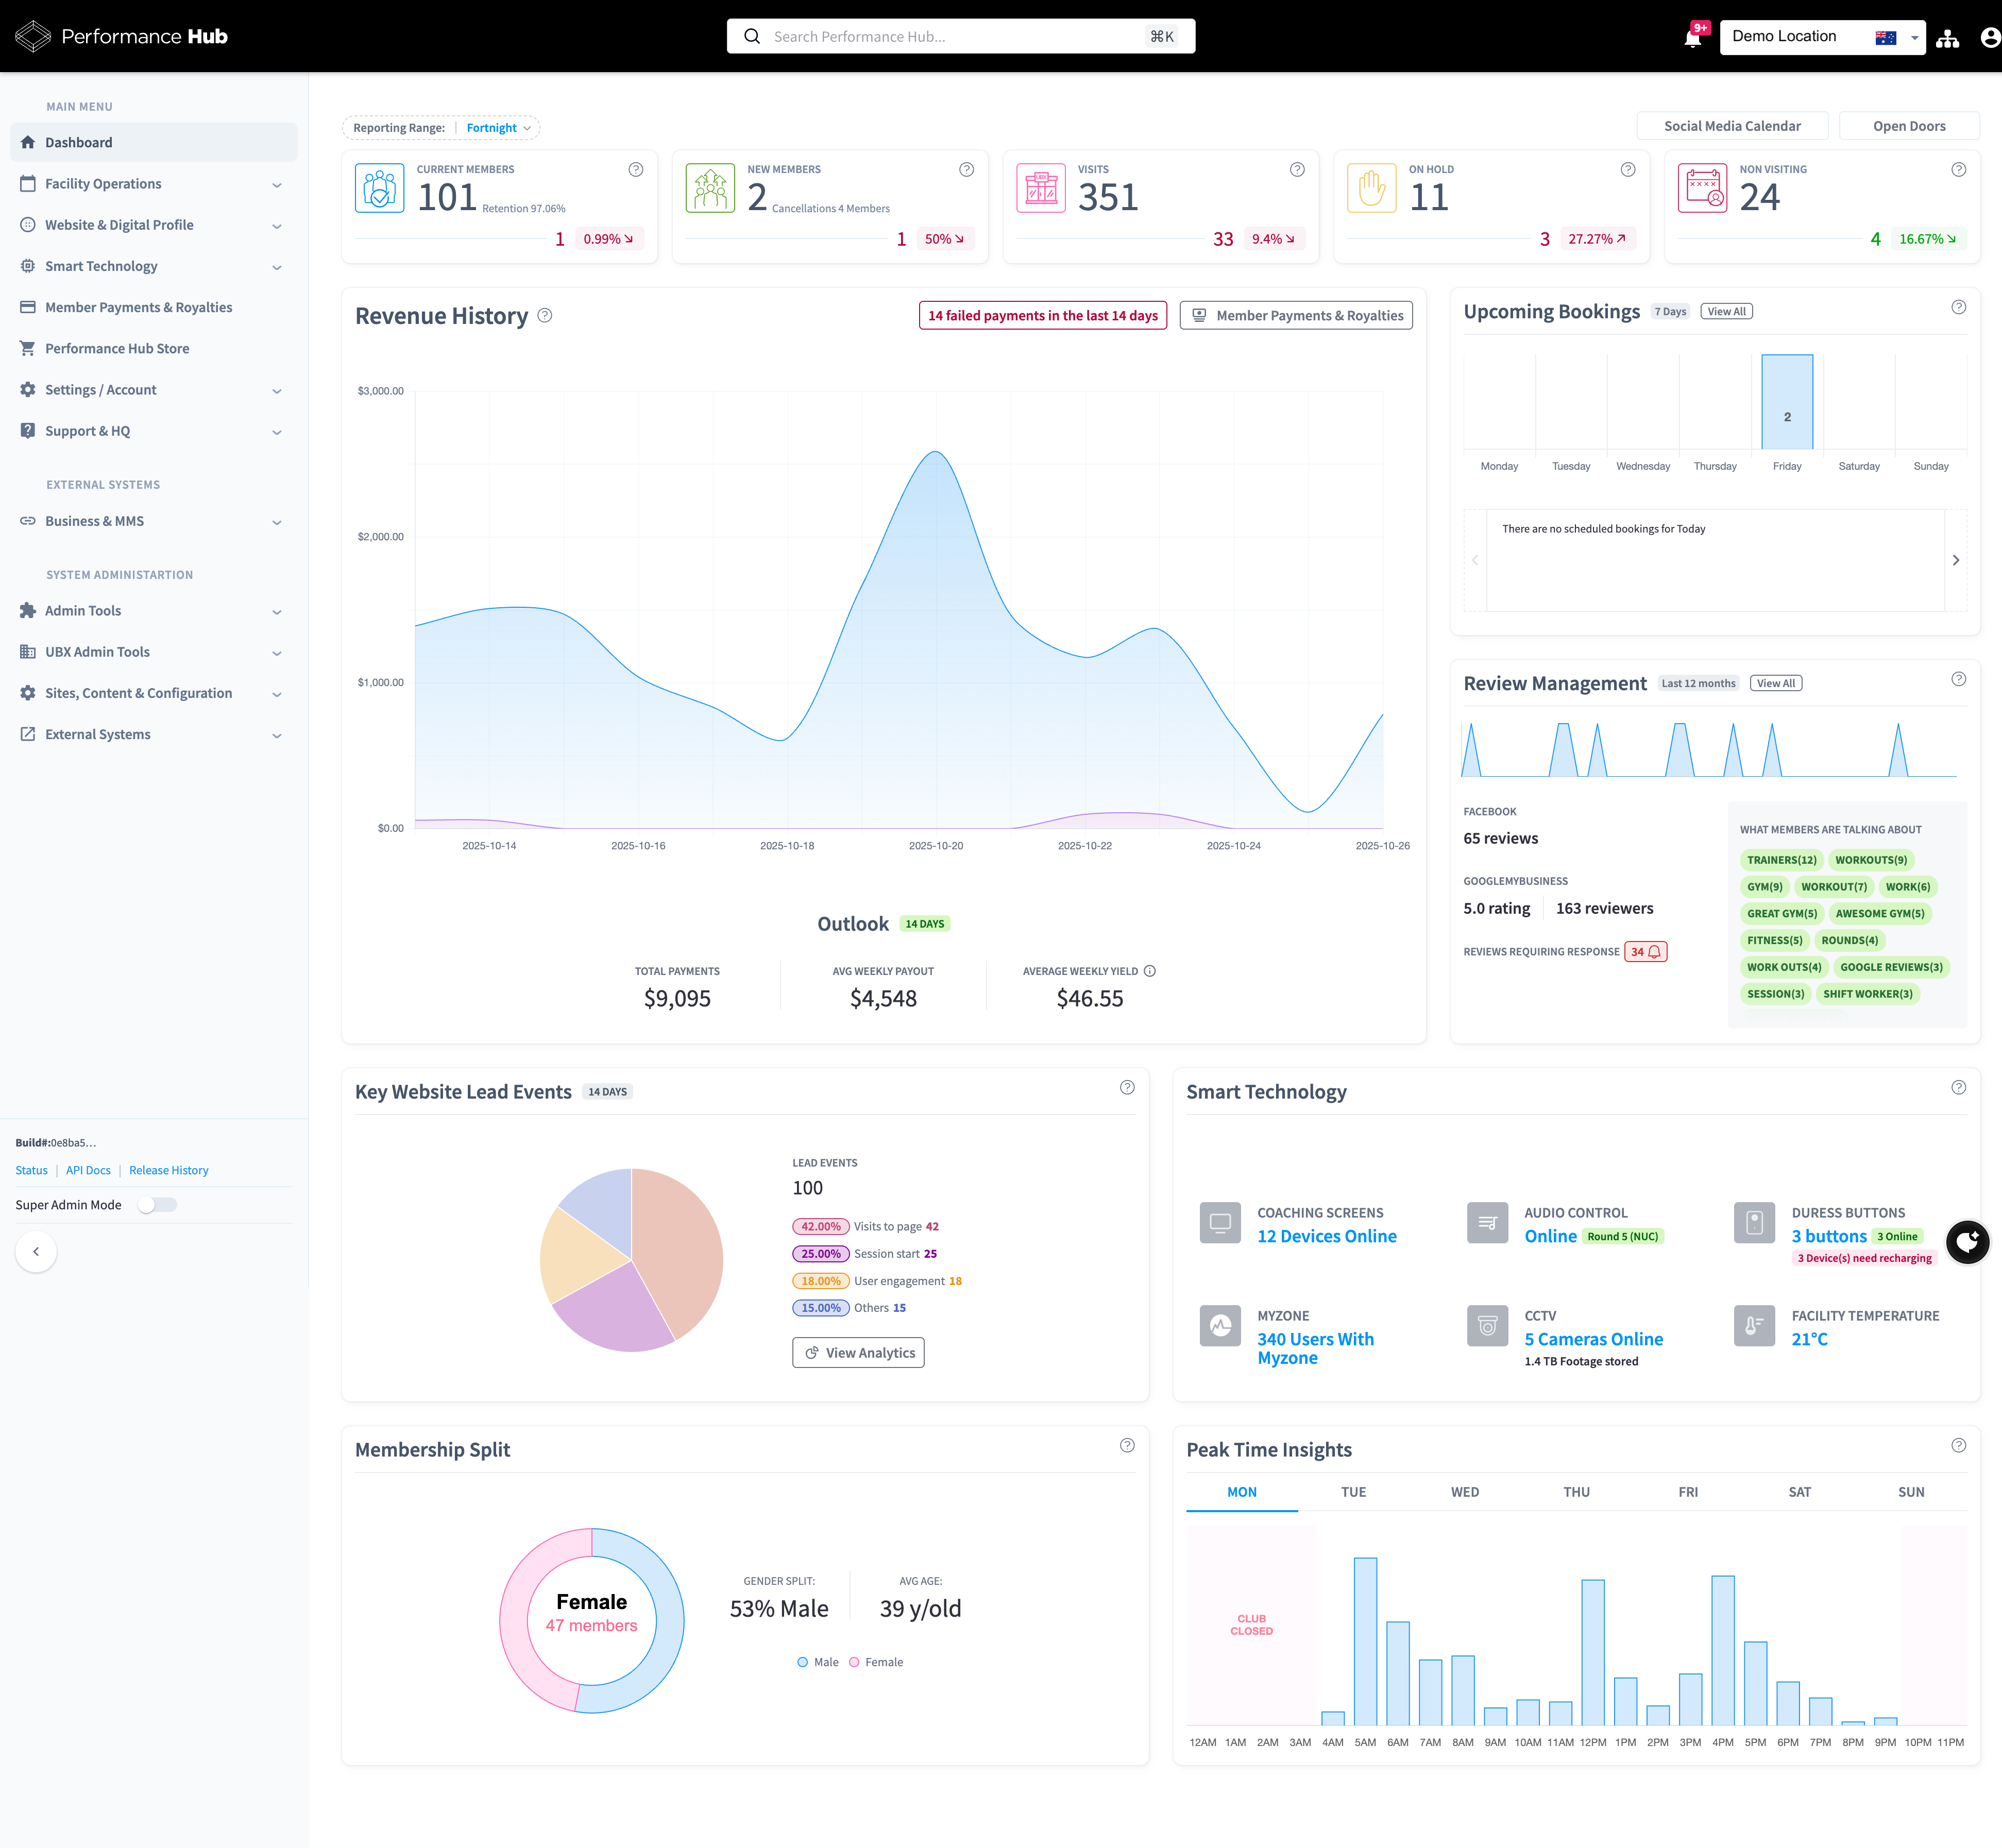
Figure 1: Dashboard showing revenue trends, upcoming bookings, reviews, smart technology status, and member insights
Dashboard Customization
IMPORTANT
Your Dashboard view is configured by your organizational administrator. The specific sections and data you see depend on your configuration.
Configuration Factors
Partner Member Management Integration - The widgets you see (such as summary cards, revenue history, bookings, membership insights) are determined by which partner member management integration your organization has enabled. Different partner integrations provide different capabilities and data sets:
- Each partner member management system (such as GymMaster, Mindbody, or others) offers different features and data
- The widgets displayed will match what your specific integration supports
- Widget appearance and available data may vary between different partner integrations
Enabled Modules - Which Performance Hub features your organization has activated
Connected Systems - Which additional systems are integrated (review platforms, smart devices, analytics tools)
User Permissions - Your user role and access level within the organization
What This Means for You
The sections described in this guide represent the full range of available Dashboard features across all possible integrations. You may see all, some, or different combinations of these features depending on:
- Which partner member management integration your organization uses
- Your organization's specific configuration
- Your user access permissions
If you have questions about your Dashboard setup or need access to additional features, contact your organizational administrator.
Main Features
The Dashboard can include:
- Flexible time periods - View data across multiple time ranges
- Revenue tracking - See payment trends and get alerts for failed payments
- Booking overview - View the next 7 days of scheduled sessions
- Review monitoring - Track customer ratings and feedback
- Smart device status - Monitor all connected equipment in real-time
- Member insights - Understand your membership composition and activity
- Website analytics - Track visitor interest and conversions
Core Dashboard Elements
Time Range Selector
At the top of your Dashboard, you'll find a dropdown labeled "Reporting Range" to control the reporting period.
Default setting: Fortnight (14 days)
Available options:
- Day
- Week (7 days)
- Fortnight (14 days)
- 28 Days
- Last 2 months
- Last 6 months
- Last 12 months
Your selection applies to most Dashboard sections and will be remembered for your next visit.
Quick Action Buttons
Social Media Calendar - Opens your marketing content calendar where you can plan and schedule social media posts.
Open Doors - Remotely unlock facility doors (only appears if you have door control devices installed).
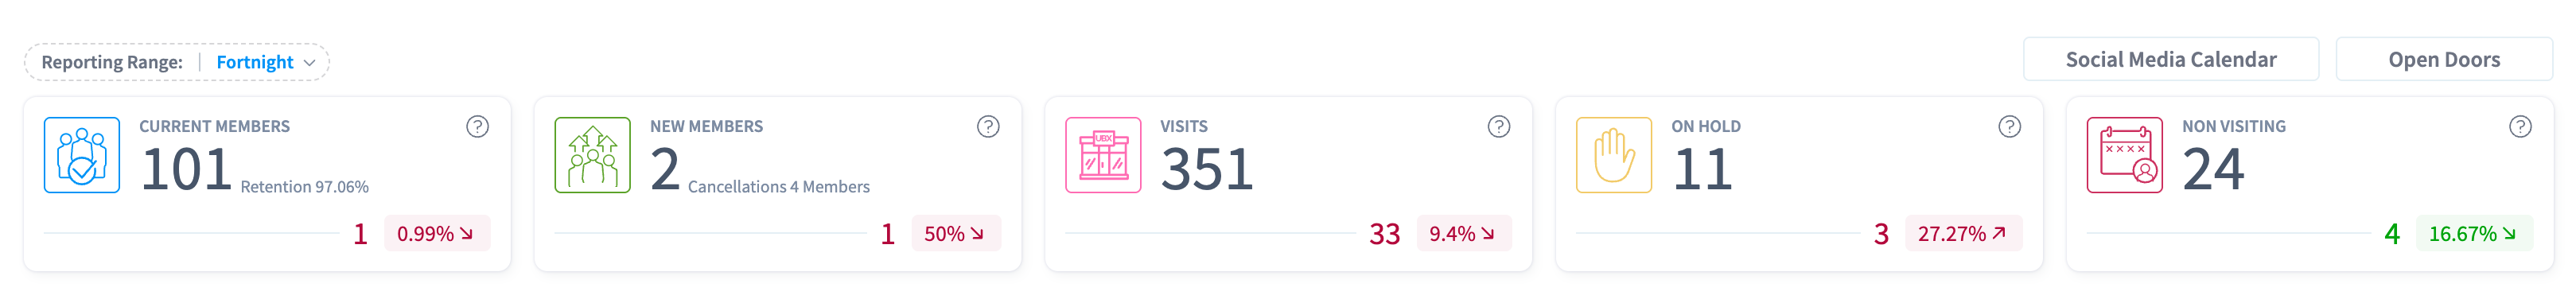
Summary Cards (Top Row)
The cards at the top of your Dashboard show quick stats like active member count, new signups, revenue totals, and device status. The specific cards you see are determined by your partner member management integration—each integration provides different data types and metrics. Your organizational administrator configures which cards are displayed based on your integration's capabilities.
📊 Dashboard Sections
The Dashboard is organized into several key information areas. Click each section below to view detailed documentation:
💰 Revenue and Bookings
Track financial performance and upcoming appointments
Covers: Revenue history charts, payment statistics, failed payment alerts, upcoming bookings schedule, booking management
⭐ Reviews and Website Leads
Monitor customer feedback and website visitor activity
Covers: Review monitoring, average ratings, response tracking, website lead events, visitor interest tracking
🔧 Smart Technology and Member Insights
Monitor connected devices and understand membership patterns
Covers: Coaching screens, audio control, duress buttons, MyZone integration, security cameras, facility temperature, membership demographics, peak time analysis
Special Situations
When You First Sign Up
If you've just created your account and haven't been assigned to a facility yet, you'll see a welcome screen with:
Welcome Message - Explains that you have limited access until connected to a facility
Quick Links - Buttons to access:
- Performance Hub Store (equipment and supplies)
- Knowledge Base (help articles)
- Support & Ticketing
Request Facility Access Form - Fill this out to request association with your facility. You'll need to provide:
- Your full name
- Contact phone number (include country code)
- Facility name and location
Once your request is processed, you'll gain full access to all features.
When Your Partner Member Management Integration Is Offline
If your partner member management integration is temporarily unavailable, you'll see:
Error Message - "Could not access Member Management System at this time"
Explanation - Prompts you to check that your integration is properly configured and the system is online
Configure Now Button - Takes you to integration settings where you can verify connection status
Affected Sections - The following Dashboard sections rely on your partner member management integration data:
- Summary cards
- Revenue history
- Bookings
- Check-in history
- Membership split
Other sections like Smart Technology and Website Analytics will continue to work normally.
Customizing Your View
Changing the Time Range
- Locate the "Reporting Range" dropdown at the top of the Dashboard
- Click to see available options:
- Day (1 day)
- Week (7 days)
- Fortnight (14 days)
- 28 Days
- Last 2 months
- Last 6 months
- Last 12 months
- Select your preferred time period
- The Dashboard will refresh to show data for your selected range
- Your choice is saved and will be remembered next time you visit
Which Sections Use the Time Range
The time range setting affects:
- Revenue History
- Summary cards (where applicable)
Some sections have fixed time periods:
- Upcoming Bookings (always next 7 days)
- Review Management (always last 12 months)
- Website Lead Events (always last 1 day)
Getting Help
In-Product Help
Look for the info icon (ⓘ) next to section titles. Hover over it to see a quick explanation of what that section shows.
Knowledge Base
Access help articles and guides from the main menu → Facility Operations → Knowledge Base
Support
Need assistance? Go to main menu → Support & HQ to:
- Submit a support ticket
- Chat with support team
- Check system status
Status Page
Check if there are any known issues: https://status.performancehub.co/
Additional Resources
Tips and Best Practices - Daily routines, weekly reviews, and best practices for getting the most value from your Dashboard.
Common Questions - Frequently asked questions about Dashboard features, data, and troubleshooting.
The Dashboard is your window into facility performance. Check it regularly to stay informed and make data-driven decisions that improve member experience and business outcomes.